API Monitoring and Observability Tools: A Practical Comparison
A practical comparison of API monitoring and observability tools: categories, criteria, architectures, cost controls, and decision recipes.

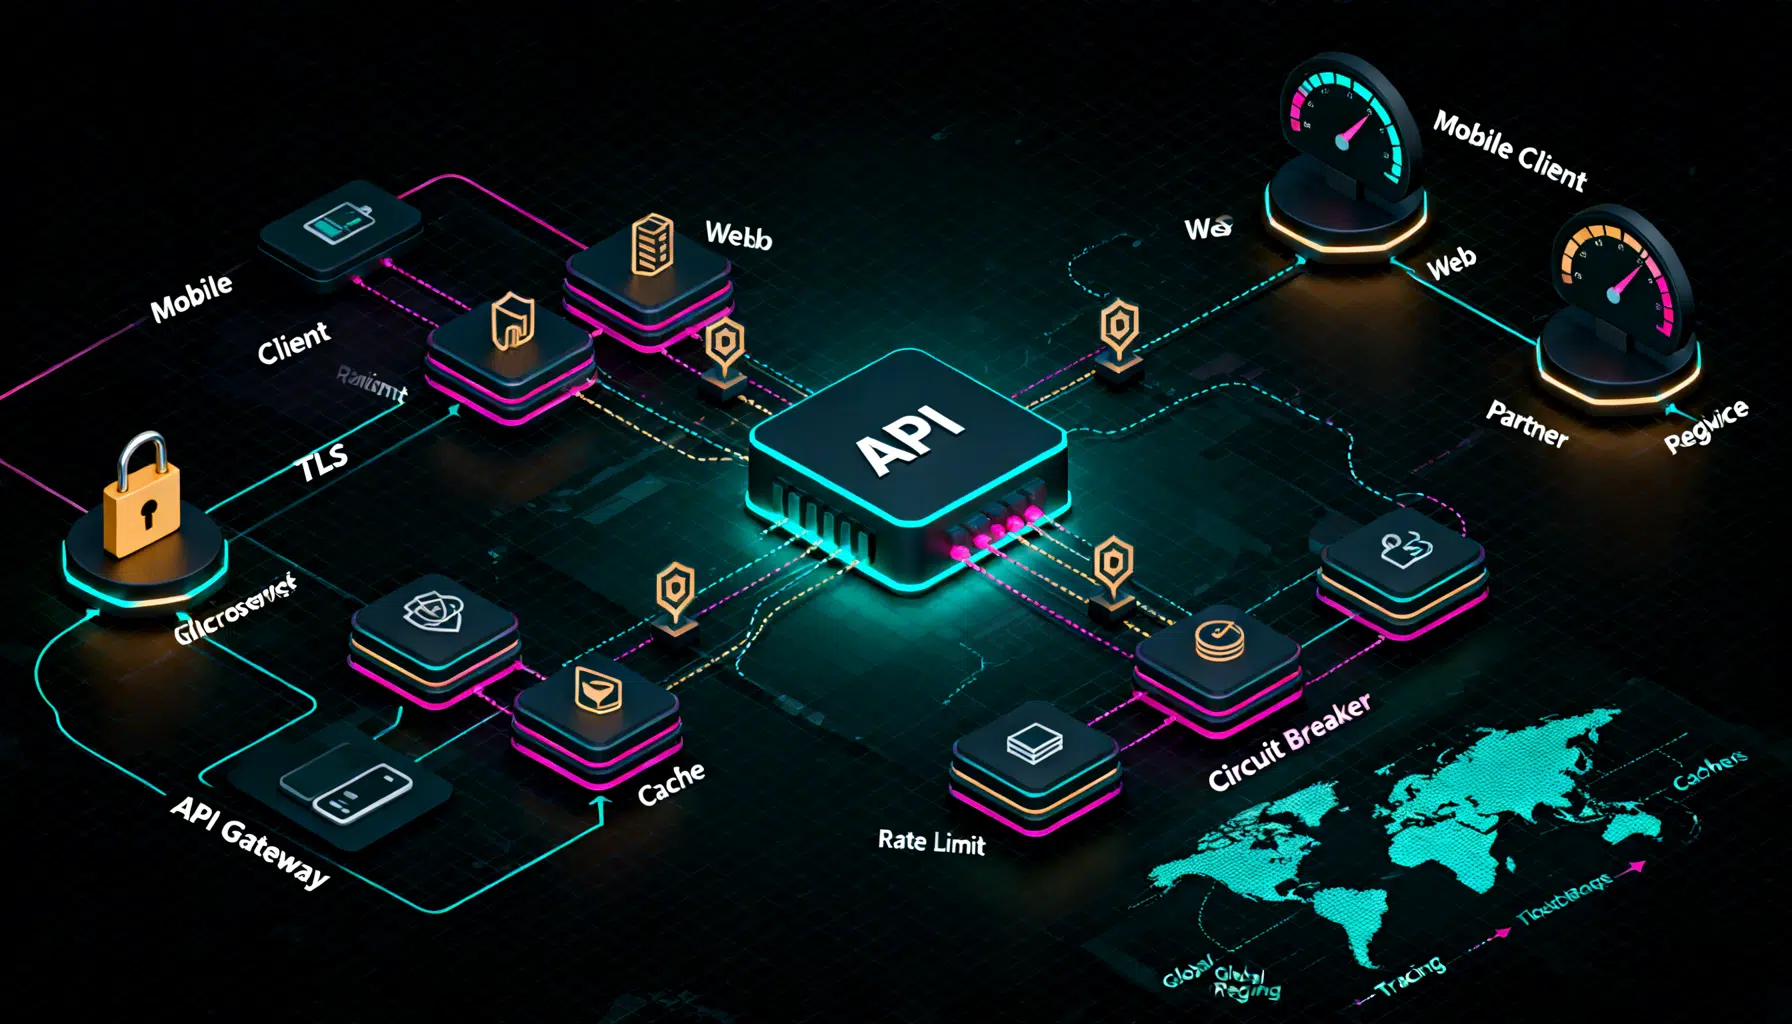
Image used for representation purposes only.
Why API Monitoring And Observability Matter
APIs are the nervous system of modern software. They connect microservices, power mobile apps, and drive partner ecosystems. When an API slows down or fails, customer experience suffers immediately and revenue often follows. Monitoring tells you when something is wrong; observability helps you understand why. In practice, high-performing teams blend both: proactive monitoring of known signals plus rich, ad‑hoc exploration across metrics, logs, and traces to answer unknown questions.
This article compares the main categories of API monitoring and observability tools, outlines key evaluation criteria, and provides decision recipes, reference architectures, and pitfalls to avoid.
Monitoring vs. Observability: A quick alignment
- Monitoring: Curated, known indicators (SLIs) with thresholds and alerts. Examples: latency p95, error rate, saturation, availability.
- Observability: The ability to explain internal state from external outputs. Practically: high‑cardinality metrics, structured logs, distributed traces, exemplars, and correlation features that help you move from symptom to cause quickly.
- For APIs, you need both: synthetic checks and SLO alerts to catch customer-impacting issues, and trace/metrics/log correlation to root-cause across services, gateways, caches, and databases.
Core capabilities to compare
When evaluating tools or stacks, prioritize these capabilities and how well they fit your team’s skills, scale, and budget.
- Data collection and standards
- Native support for OpenTelemetry (OTel) for metrics, traces, and logs
- Auto-instrumentation for common runtimes and frameworks (HTTP, gRPC, GraphQL)
- Agent vs. agentless collection; gateway and sidecar integrations
- API‑specific monitoring
- Synthetic monitors for REST, GraphQL, and gRPC
- Multi-step flows with variables, auth, and assertions
- Geo-distributed checks and private locations for internal APIs
- Signal depth and correlation
- Distributed tracing with span attributes, events, exemplars
- Error tracking with payload/context capture and replay where appropriate
- Metrics with high-cardinality labels and histogram support
- Log management with schema-on-write or schema-on-read, index/ingest controls
- Reliability engineering features
- SLOs/SLIs with burn-rate and multi-window, multi-burn alerts
- Dependency maps and service topology
- Runbooks and alert enrichment (links to traces, dashboards, playbooks)
- Performance and scale
- Cost controls: sampling, tail-based sampling, dynamic ingest filters
- Query performance at high cardinality and long retention
- Data lifecycle: hot, warm, cold tiers
- Security and governance
- PII redaction at source, edge, and storage
- RBAC/ABAC, SSO, audit logs, tenant isolation
- Compliance support (SOC 2, ISO 27001, HIPAA, etc.)
- Ecosystem fit
- Integrations with API gateways, service meshes, CI/CD, incident tooling
- Dashboards and notebooks for collaborative debugging
- Programmable alerting and APIs for automation
The landscape: tool categories and where they fit
Below are broad categories with representative examples you’re likely to encounter. Use these as anchors for comparison rather than endorsements of specific vendors.
-
Full‑stack APM platforms
- Strengths: end-to-end visibility, automated topology, strong alerting/SLO features, broad integrations, out-of-the-box dashboards.
- Consider when: you want a single commercial platform covering metrics, logs, traces, synthetics, error tracking, and RUM.
- Watch for: cost at scale, data ingestion pricing, vendor lock-in.
-
Cloud‑native/OSS observability stacks
- Common components: Prometheus (metrics), Grafana (visualization), Loki (logs), Tempo/Jaeger (traces), OpenTelemetry Collector (pipelines), alerting (Alertmanager), and synthetic checks (k6 or Grafana synthetics).
- Strengths: flexibility, control, cost transparency, community standards.
- Consider when: you have platform engineering capacity and desire portability.
- Watch for: operational overhead, query performance at high cardinality, multi-tenant security.
-
API gateway and management platforms
- Examples include enterprise gateways and cloud-native gateways widely used in microservice architectures.
- Strengths: deep request analytics at the edge, built-in policies (auth, rate limiting, caching), developer portal metrics, monetization analytics.
- Consider when: gateway-level visibility and governance are primary; pair with tracing/logging backend for full stack views.
- Watch for: limited cross-service correlation unless paired with traces/logs.
-
Synthetic and API testing specialists
- Strengths: rich multi-step monitors, assertions, data-driven tests, private locations, schedule control, and easy setup for uptime and latency SLIs.
- Consider when: you need robust external perspective monitoring, contract testing, or pre-production smoke tests.
- Watch for: lacks deep back-end correlation unless integrated with tracing/logging.
-
Developer-centric tracing and event analysis platforms
- Strengths: high-cardinality tracing, powerful query languages, flexible sampling strategies, fast iterative debugging.
- Consider when: microservices scale is high and root cause across services is your main pain.
- Watch for: you may need to complement with synthetics and log management.
-
Cloud provider–native services
- Strengths: tight integration with managed services, IAM, and billing; good baseline monitoring and log retention.
- Consider when: your footprint is mostly on one cloud or you need quick wins.
- Watch for: multi-cloud visibility gaps, UX differences across services, and cross-signal correlation limitations.
How the categories compare by job-to-be-done
- Catch customer-impacting regressions before release
- Use synthetic specialists or k6 in CI/CD for contract and performance tests.
- Proactively detect production incidents
- Combine synthetics (external) with SLO burn-rate alerts on server-side metrics (internal).
- Root-cause distributed latency and errors
- Rely on tracing-centric platforms or APM suites with strong service maps and span analytics.
- Control observability spend at scale
- Use OTel Collector for dynamic sampling, metric relabeling, and log/trace filtering before storage.
- Unified governance and compliance
- Favor platforms with fine-grained RBAC, auditability, and robust redaction at ingest.
Reference architecture for API observability
A pragmatic reference architecture pairs open standards with your chosen backend(s):
- Instrumentation
- Use OpenTelemetry SDKs/auto-instrumentation for services (HTTP, gRPC, DB clients).
- Standardize semantic conventions for attributes like http.route, http.method, user_id (redacted), tenant, and business keys.
- Ingest and control plane
- Deploy OpenTelemetry Collectors centrally and at the edge. Use them to:
- Receive OTLP over gRPC/HTTP
- Apply processors for redaction, attributes, batching, and resource detection
- Implement tail-based sampling for traces (keep slow/error traces, sample normal traffic)
- Fan-out to multiple backends (A/B backends during migrations)
- Storage and analytics backends
- Choose one or more destinations: APM suite, OSS stack (Prometheus/Loki/Tempo), cloud-native services.
- Ensure dashboards link across signals. From an alert, you should jump to a trace, then to related logs, then to code/commit if possible.
- External perspective
- Add synthetic monitors that hit public and private endpoints, authenticate like real clients, and assert on status, latency, and payload shape.
- SLOs and incident workflows
- Define SLIs per API (availability, latency p95/p99, correctness). Publish SLOs with burn-rate alerts and clear runbooks.
- Integrate alerting with on-call, ticketing, and collaboration tools.
Example: OpenTelemetry Collector pipeline
receivers:
  otlp:
    protocols:
      grpc:
      http:
processors:
  batch: {}
  attributes:
    actions:
      - key: user.email
        action: delete
  probabilistic_sampler:
    sampling_percentage: 5
  tail_sampling:
    decision_wait: 5s
    policies:
      - name: errors
        type: status_code
        status_code:
          status_codes: [ERROR]
      - name: slow-traces
        type: latency
        latency:
          threshold_ms: 500
exporters:
  otlphttp/apm:
    endpoint: https://apm.example.com/v1/traces
  otlphttp/oss:
    endpoint: http://otel-gateway.local:4318
service:
  pipelines:
    traces:
      receivers: [otlp]
      processors: [batch, attributes, tail_sampling]
      exporters: [otlphttp/apm, otlphttp/oss]
    metrics:
      receivers: [otlp]
      processors: [batch]
      exporters: [otlphttp/apm]
Example: k6 API synthetic check (CI-safe)
import http from 'k6/http';
import { check, sleep } from 'k6';

export const options = { vus: 5, duration: '30s' };

export default function () {
  const res = http.get(`${__ENV.BASE_URL}/v1/orders?limit=10`, {
    headers: { Authorization: `Bearer ${__ENV.API_TOKEN}` },
  });
  check(res, {
    'status is 200': (r) => r.status === 200,
    'p95 < 300ms': (r) => r.timings.duration < 300,
    'has expected shape': (r) => JSON.parse(r.body).items?.length >= 0,
  });
  sleep(1);
}
Cost and governance: avoiding surprises
- Price dimensions to model
- Ingested GB for logs and traces; time series count and active series for metrics; number of synthetic checks and frequency; host/container/serverless spans.
- Techniques to control spend without losing signal
- Tail-based trace sampling that keeps error/slow traces at 100% and samples normal traffic.
- Metric hygiene: avoid unbounded label values; use relabeling to drop high-cardinality noise.
- Log hygiene: structure logs, drop DEBUG in production, and route verbose logs to cheaper storage with shorter retention.
- Synthetics: run high-frequency checks on critical paths; lower frequency on non-critical.
- Governance
- Central guardrails in the OTel Collector for PII redaction and attribute whitelisting.
- Per-team budgets and usage dashboards; alert when ingest or cardinality spikes.
Pitfalls to avoid
- Treating synthetics as a replacement for tracing. You need both inside-out and outside-in visibility.
- Ignoring semantic conventions. Without consistent attributes, correlation and SLOs become guesswork.
- Over-indexing on dashboards. Favor workflows that start from alerts and pivot into traces/logs tied to the exact user impact.
- Unlimited cardinality. High-cardinality labels (user_id, session_id) must be sampled or redacted at source.
- Vendor sprawl without a routing strategy. If you use multiple backends, centralize pipelines via the Collector to keep control.
Evaluation checklist for demos and RFPs
- Data ingest
- Can we ingest OTLP natively? How hard is auto-instrumentation for our runtimes?
- What’s the overhead of agents/collectors and how is it measured?
- Correlation and query experience
- From a failing synthetic, can we jump to the exact trace and related logs?
- Can we filter by HTTP route, tenant, version, release, and region at scale?
- Reliability engineering
- First-class SLOs with burn-rate alerts and error budget policies?
- Support for change events (deploys, feature flags) on charts?
- Operations and cost
- Tail-based sampling? Cardinality and ingest controls? Transparent pricing?
- Data lifecycle tiers and export options for portability?
- Security and compliance
- Redaction at ingest? Field-level controls? Audit trails? Regional data residency?
Decision recipes
- Startup with a small team
- Choose a managed APM or cloud-native service with strong OTLP support; add a lightweight synthetic provider or k6 in CI.
- Regulated enterprise
- Favor platforms with granular RBAC, audit logs, private locations for synthetics, data residency controls; consider hybrid storage.
- High-scale microservices with frequent deploys
- Prioritize tracing-first platforms with tail-based sampling and powerful high-cardinality queries; pair with Prometheus/Grafana and targeted synthetics.
- API product with external SLAs
- Emphasize synthetic coverage from user geographies, contract tests in CI, clear SLOs and burn alerts, and executive-friendly availability reports.
Bringing it together: a pragmatic stack
- Instrument with OpenTelemetry everywhere.
- Run OTel Collectors as the control plane for redaction, sampling, and routing.
- Pick a primary backend aligned to your team’s skills (APM suite or OSS stack) and supplement selectively:
- Tracing powerhouse if root cause time is your bottleneck.
- Synthetic specialist if external SLA reporting is critical.
- Implement SLOs per API, with burn alerts mapped to on-call rotations and runbooks.
- Review cost and cardinality weekly; treat ingest like production capacity planning.
Key takeaways
- Blend monitoring and observability: synthetics and SLOs to catch issues; traces/metrics/logs to explain them.
- Choose categories, not brands, first—optimize for your job-to-be-done and team capacity.
- Standardize on OpenTelemetry and centralize pipelines to preserve leverage and control costs.
- Make reliability a product: publish SLOs, track error budgets, and close the loop with incident reviews and change tracking.
Related Posts

API‑First Development: An End‑to‑End Workflow Guide
A practical, end-to-end API-first workflow: design, mock, test, secure, observe, and release with contracts as the single source of truth.

The Engineer’s Guide to Multi-Modal AI API Integration
A practical, production-ready guide to integrating multi-modal AI APIs—covering architecture, streaming, function calling, safety, cost, and reliability.
API Gateway Design Patterns: A Practical, High‑Performance Guide
A practical guide to API gateway design patterns: when to use them, trade-offs, and reference configs for secure, scalable microservices and edge APIs.