API Observability with Distributed Tracing: Patterns, Pitfalls, and Production Tactics
A practical guide to API observability with distributed tracing—OpenTelemetry, W3C Trace Context, sampling, correlation, and cost control you can operate.
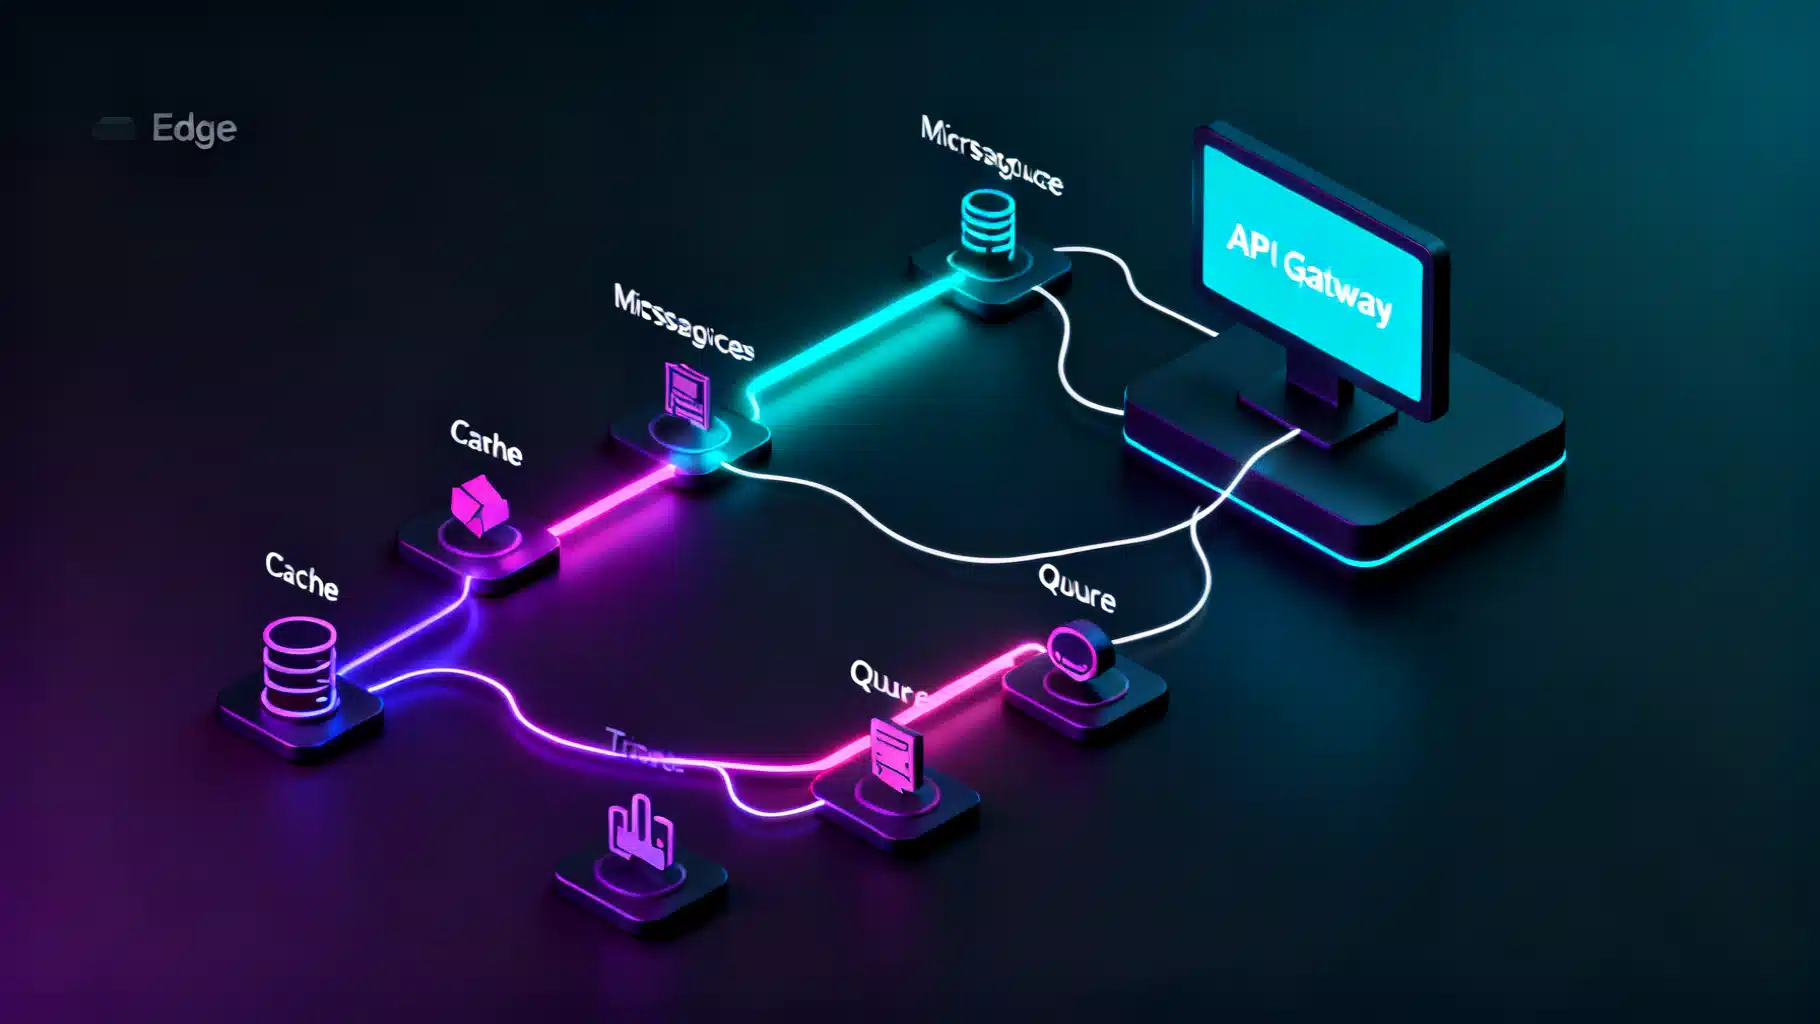
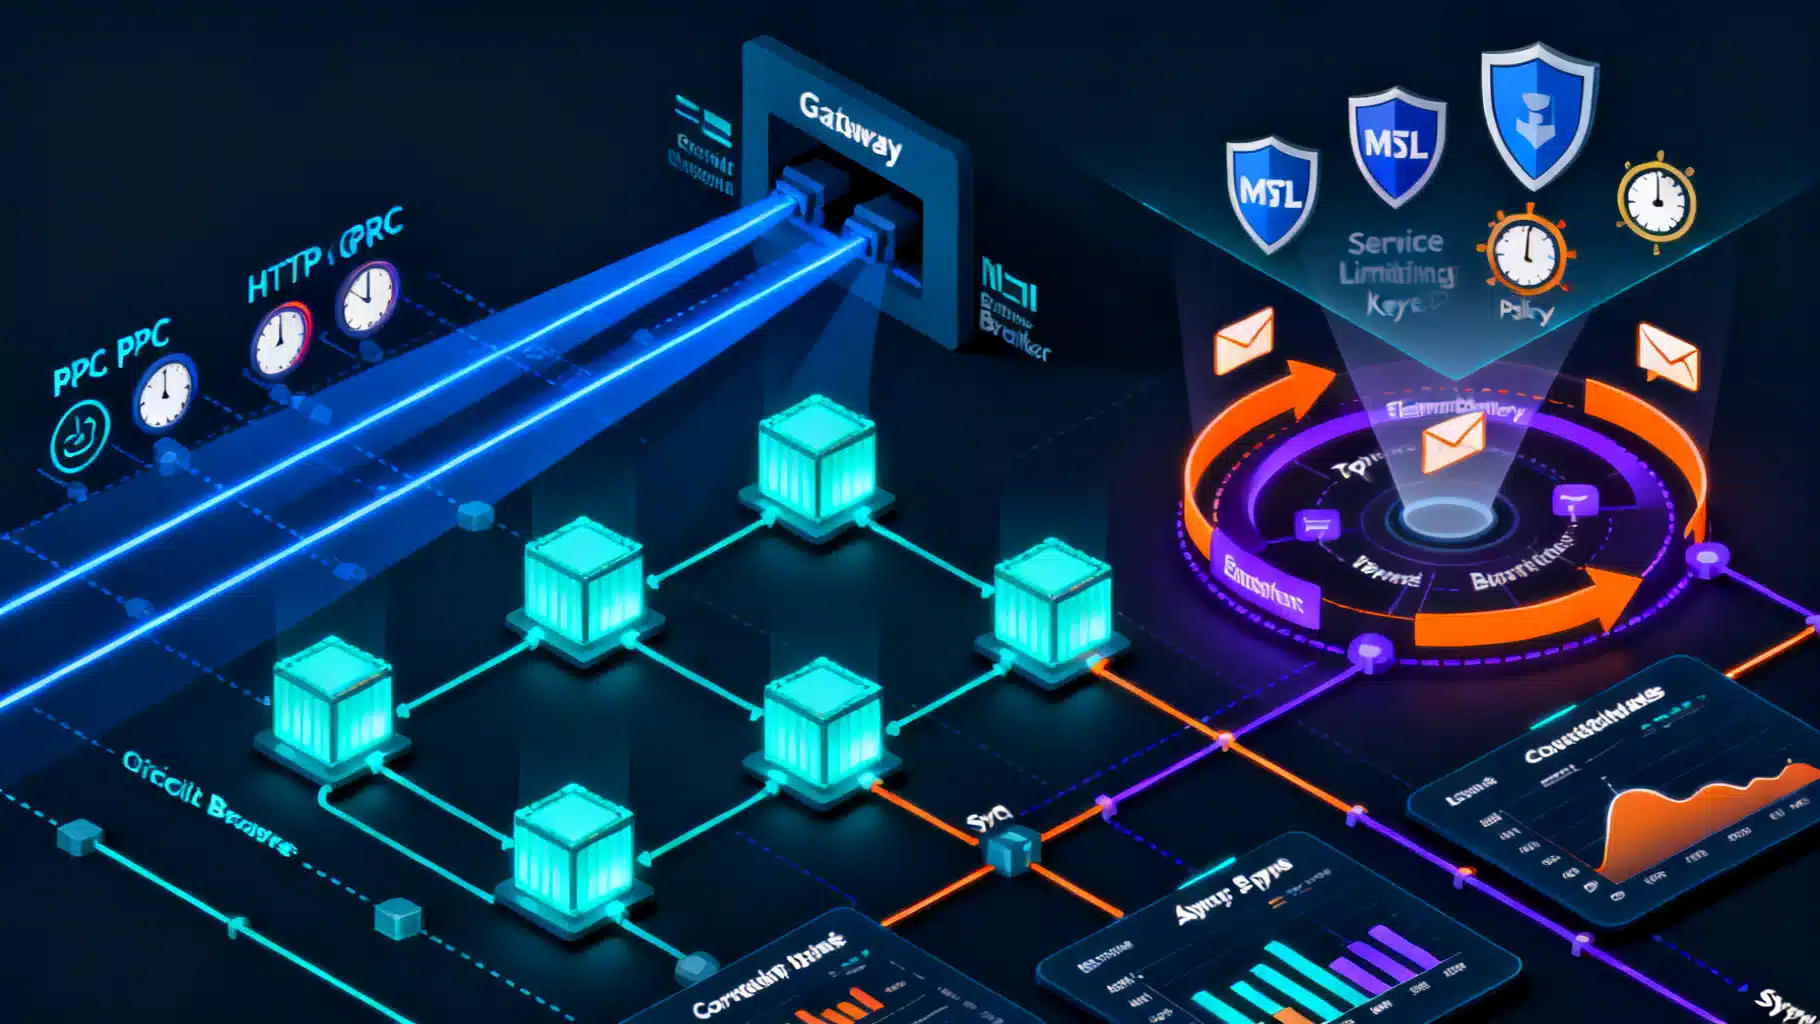
Image used for representation purposes only.
Why Distributed Tracing Is the Backbone of API Observability
APIs are the connective tissue of modern systems. When a mobile tap or webhook fans out across gateways, microservices, databases, and queues, a single customer action becomes dozens of network hops. Metrics tell you “what” (rates, errors, durations). Logs tell you “what happened here.” Distributed tracing tells you “how the whole request actually flowed.” It is the end-to-end narrative that makes API observability actionable.
This guide explains the core concepts, the standards that make tracing portable, how to instrument with OpenTelemetry, and the practices that keep costs in check while improving mean-time-to-diagnose (MTTD).
Core Concepts: Traces, Spans, Context
- Trace: The full story of a single request or workflow.
- Span: A timed unit of work within a trace (e.g., “POST /orders,” “SELECT from payments”). Spans carry attributes (key–value metadata), events (time-stamped notes), and status (OK, ERROR).
- Context propagation: The mechanism for passing the trace identity across network boundaries so all spans align into one trace.
- Links: References from one trace or span to another (crucial for async, fan-out, or batch processing).
A helpful mental model: a trace is a tree (or DAG) of spans. Parent spans wrap child spans. When a service calls another, it forwards trace context headers so the child span can attach to the same tree.
Standards That Make Tracing Work Everywhere
- W3C Trace Context (HTTP):
- traceparent: carries trace-id, parent-id (span-id), version, and sampling flags.
- tracestate: vendor-specific notes for sampling/tuning.
- W3C Baggage: key–value pairs for cross-service hints (be cautious—baggage is sent on every hop).
- gRPC: Uses metadata to transmit the same context fields.
Example traceparent header:
traceparent: 00-4bf92f3577b34da6a3ce929d0e0e4736-00f067aa0ba902b7-01
- 00: version
- 4bf9…4736: trace-id (128-bit)
- 00f0…02b7: parent span-id (64-bit)
- 01: sampled flag (01 yes, 00 no)
Adopt W3C Trace Context universally—at gateways, services, functions, and jobs—to avoid broken or forked traces.
Instrumentation: Auto, Manual, and “Just Enough”
OpenTelemetry (OTel) is the de‑facto standard for generating traces, metrics, and logs. It provides:
- Language SDKs (Java, JavaScript/TypeScript, Python, Go, .NET, Ruby, PHP, C++).
- Auto-instrumentation for common frameworks (HTTP servers/clients, gRPC, SQL drivers, messaging libs).
- An OpenTelemetry Collector to receive, process, sample, and export telemetry via OTLP.
Minimal HTTP service examples
Node.js (Express) with auto-instrumentation:
npm i @opentelemetry/api @opentelemetry/sdk-node \
  @opentelemetry/auto-instrumentations-node @opentelemetry/exporter-trace-otlp-http express
// tracing.js
const { NodeSDK } = require('@opentelemetry/sdk-node');
const { getNodeAutoInstrumentations } = require('@opentelemetry/auto-instrumentations-node');
const { OTLPTraceExporter } = require('@opentelemetry/exporter-trace-otlp-http');

const sdk = new NodeSDK({
  traceExporter: new OTLPTraceExporter({ url: process.env.OTLP_ENDPOINT }),
  instrumentations: [getNodeAutoInstrumentations()],
});

sdk.start();
// server.js
require('./tracing');
const express = require('express');
const app = express();
app.post('/orders', async (req, res) => {
  // Business logic; spans for HTTP server, DB calls, and HTTP clients are automatic
  res.json({ ok: true });
});
app.listen(8080);
Java (Spring Boot) with OTel agent:
java -javaagent:opentelemetry-javaagent.jar \
  -Dotel.service.name=orders-api \
  -Dotel.exporter.otlp.endpoint=$OTLP_ENDPOINT \
  -jar app.jar
Auto-instrumentation captures servlet, HTTP client, JDBC, and messaging spans; add manual spans for domain steps only where they clarify the story.
Python (FastAPI) with manual span enrichment:
pip install opentelemetry-sdk opentelemetry-exporter-otlp opentelemetry-instrumentation-fastapi uvicorn
from fastapi import FastAPI
from opentelemetry import trace
from opentelemetry.sdk.trace import TracerProvider
from opentelemetry.sdk.trace.export import BatchSpanProcessor
from opentelemetry.exporter.otlp.proto.http.trace_exporter import OTLPSpanExporter

trace.set_tracer_provider(TracerProvider())
tracer = trace.get_tracer(__name__)
trace.get_tracer_provider().add_span_processor(
    BatchSpanProcessor(OTLPSpanExporter(endpoint=os.getenv("OTLP_ENDPOINT")))
)

app = FastAPI()

@app.post("/pay")
def pay():
    with tracer.start_as_current_span("authorize-card") as span:
        span.set_attribute("payment.method", "visa")
        # call out to PSP, DB, etc.
    return {"status": "ok"}
Guidelines:
- Use auto‑instrumentation for breadth; add manual spans where it reduces ambiguity (e.g., domain steps, retries, cache branches).
- Enrich spans with stable, low‑cardinality attributes (e.g., customer_tier=gold, region=us-east-1). Avoid unbounded values.
Collectors, Storage, and Backends
Architecture pattern:
- SDKs/agents emit OTLP to the OpenTelemetry Collector.
- Collector performs batching, filtering, tail-based sampling, and redaction.
- Export to a backend: Jaeger, Tempo, Zipkin, or vendors (e.g., Honeycomb, Datadog, New Relic, Elastic).
Tips:
- Run regional collectors close to traffic to minimize egress and protect PII via processors.
- Keep spans light: attributes < 50 typical; events for detailed breadcrumbs when needed.
- Retain raw traces briefly; retain high-value traces longer via tail sampling.
Sampling Strategies You Can Actually Operate
- Head-based sampling: Decide at the start of a trace (cheap, but may miss rare failures).
- Tail-based sampling: Decide after seeing the whole trace (powerful, requires a collector and buffering).
- Dynamic sampling: Rules that upsample on error, latency, or specific endpoints/tenants.
- Probabilistic vs rules-based: Combine both (e.g., 1% default, 100% on 5xx, 20% on p95>500ms, 50% for key tenants).
SLO-aware approach:
- Always keep error traces.
- Heavily sample slow traces above your SLO threshold.
- Keep exemplars for each route+status bucket to preserve distribution shapes.
Correlating Traces, Metrics, and Logs
- Inject trace_id and span_id into logs. Configure your logger to pull from the active span context.
- Use exemplars to link metrics histograms to example traces.
- Golden signals for APIs: Rate, Errors, Duration (RED). Build SLOs on these, then use traces to explain burn-rate spikes.
Example log format (JSON):
{
  "ts": "2026-05-04T17:01:00Z",
  "level": "warn",
  "msg": "timeout contacting PSP",
  "trace_id": "4bf92f3577b34da6a3ce929d0e0e4736",
  "span_id": "00f067aa0ba902b7",
  "customer_tier": "gold"
}
Gateways, Meshes, and Edge Concerns
- API Gateways (Kong, NGINX, APIM, Envoy) should accept/generate W3C headers and forward them.
- Service Mesh (Istio/Envoy, Linkerd) can auto‑trace inbound/outbound calls; still propagate context in app code for non-HTTP work (DB, queue, cache).
- Terminate and restart traces at true trust boundaries only when required; otherwise forward trace context to avoid fragmented narratives.
Async, Queues, and Streams
HTTP is synchronous; queues are not. Model accordingly:
- Producer span: send message; attach trace context into message headers.
- Consumer span: extract context to continue the trace or use span links when a new trace is appropriate.
- Batch consumers: link many producer spans to a single processing span.
- Idempotency and retries: annotate with attributes (retry.count) and events to make flapping visible.
For Kafka/SQS/PubSub, use messaging instrumentation that sets:
- messaging.system, messaging.operation (publish/receive), message_id, destination, partition.
Serverless and Jobs
- Cold starts: annotate spans with cold_start=true and runtime details.
- Background jobs and schedulers: start a new trace; include job.name and schedule.cron attributes. Link back to originating trace if triggered by an event.
- Edge/serverless gateways: ensure they preserve headers on egress; if they terminate TLS, confirm context survives.
Data Hygiene, Privacy, and Governance
- Never store PII in span names or high-cardinality attributes.
- Use collector processors to:
- Drop or hash sensitive fields (email, tokens).
- Normalize attribute keys to a controlled vocabulary.
- Enforce attribute budgets per span.
- Retention tiers: raw traces short (e.g., 3–7 days), high-value sampled traces longer (30–90 days).
- Access controls: restrict tenant data; consider separate projects per environment/region.
Troubleshooting Playbook
Common issues and fixes:
- Broken traces (missing parents): Verify propagation at gateways/clients; ensure outbound HTTP clients forward traceparent.
- Double spans: Disable overlapping auto‑instrumentation where the mesh already creates spans; dedupe at the collector.
- Clock skew: Prefer server-side timing; configure NTP across hosts; use collector to adjust skew.
- Cardinality explosions: Audit attributes; clamp user IDs, request IDs, or raw URLs with query strings; extract stable route templates.
- Sampling confusion: Log sampling decisions at the root; expose tracestate notes for why a trace was kept/dropped.
Querying and Visualizing What Matters
Build views that answer operational questions fast:
- API overview: p50/p90/p99 latency, error rate by route and method.
- Dependency map: upstream/downstream graph colored by error or latency.
- Outlier explorer: sort traces by duration within a route+status bucket.
- Retry/circuit patterns: mark retries, backoffs, and breaker opens in span events.
- Tenant drilldown: compare SLO burn by customer_tier or tenant.id (bounded cardinality only).
Performance and Cost Control
- Attribute discipline: prefer enums/IDs with bounded sets; avoid raw payload fragments.
- Event discipline: use span events for rare, high-signal breadcrumbs.
- Tail-based sampling at the collector: route only valuable traces to long-term storage.
- Compression and batching: tune exporter/collector batch sizes to reduce overhead.
- Filter noise: drop health checks, readiness probes, and high-frequency success pings early.
Rule of thumb: tracing should add <2–5% CPU and modest network overhead when sampled sensibly. If higher, audit auto-instrumentation scope and attribute volumes.
An Implementation Roadmap (Crawl → Walk → Run)
Crawl (1–2 sprints):
- Enforce W3C Trace Context at all edges and clients.
- Deploy OpenTelemetry Collector with OTLP over TLS.
- Auto-instrument top 3 API services and your gateway.
- Inject trace_id into logs; build a “follow the trace” link from logs to your backend.
Walk (next 1–2 months):
- Add minimal domain spans to critical flows.
- Introduce tail-based sampling with SLO-aware rules (keep errors, upsample slow requests).
- Instrument datastore and messaging clients; propagate through async.
- Create API RED dashboards and a dependency map.
Run (quarterly):
- Adopt tenant/feature-aware dynamic sampling.
- Add correlation with metrics exemplars; build SLO burn alerts that link to traces.
- Establish governance: attribute taxonomy, PII redaction, retention tiers.
- Teach on-call playbooks using traces for high-severity incident drills.
Span and Attribute Design Cheatsheet
- Span names: stable verbs and route templates (POST /orders/{id} → POST /orders/:id).
- Key attributes:
- http.method, http.route, http.status_code
- db.system, db.operation, db.statement (sanitized)
- messaging.system, destination, operation
- cloud.region, service.version, deployment.environment
- Events: retries, timeouts, circuit-breaker transitions, cache.miss/hit, fallbacks.
- Status: set ERROR with an error.type and error.message attribute (redacted).
Putting It All Together
With W3C context at the edges, OpenTelemetry across services, and a collector enforcing sampling and hygiene, distributed tracing becomes the fastest way to understand API behavior. It turns opaque production incidents into navigable stories, connects SLO breaches to specific bottlenecks, and reduces time-to-restore. Start small, propagate everywhere, sample smartly, and keep your spans informative but lean.
Related Posts
API Microservices Communication Patterns: A Practical Guide for Scale and Resilience
A practical guide to synchronous and asynchronous microservice communication patterns, trade-offs, and implementation tips for resilient APIs.

API Monitoring and Observability Tools: A Practical Comparison
A practical comparison of API monitoring and observability tools: categories, criteria, architectures, cost controls, and decision recipes.

Designing Resilient APIs with the Circuit Breaker Pattern
Learn how the API circuit breaker pattern prevents cascading failures, with design choices, observability, and code examples in Java, .NET, Node.js, and Python.