
Build a Real-Time Dashboard with GraphQL Subscriptions: A Step-by-Step Guide
Build a real-time dashboard with GraphQL subscriptions, Apollo, and React. Learn server, client, auth, and scaling patterns step-by-step.

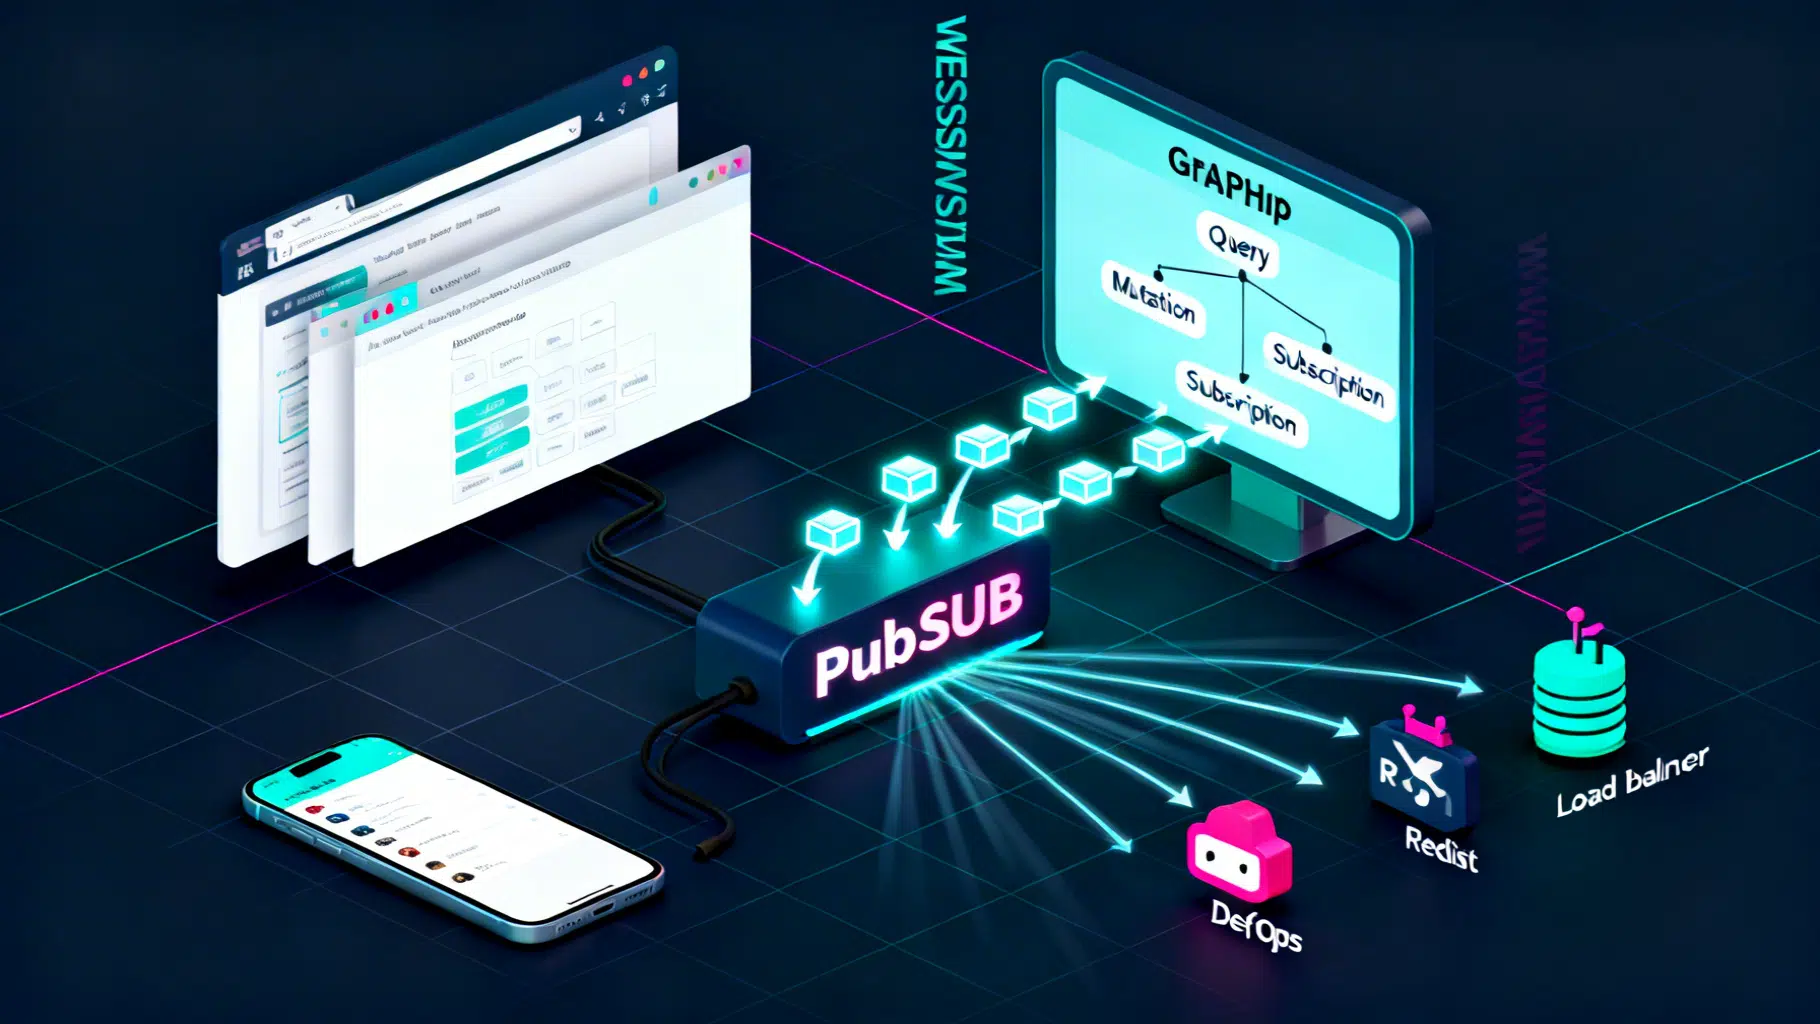
Image used for representation purposes only.
Overview
Real-time dashboards turn data into decisions. With GraphQL subscriptions and WebSockets, you can push live updates to the browser without polling, keeping charts and KPIs instantly fresh. In this hands-on tutorial, you will build a production-ready, real-time dashboard powered by a Node.js GraphQL server and a React front end using Apollo Client.
By the end, you will have:
- A GraphQL schema with queries and subscriptions
- A WebSocket-powered server using graphql-ws
- A simulated data stream that pushes updates
- A React dashboard that renders live charts with minimal latency
- Patterns for auth, scaling, and testing in production
What we will build
We will stream a simple metrics feed (CPU load, requests per second, and error rate) from a Node server to a React dashboard. The server will publish updates several times per second; the client will subscribe and render a live time series line chart and numeric KPIs.
Prerequisites
- Node.js 18+ and npm
- Basic knowledge of GraphQL schema and resolvers
- Familiarity with React hooks and component state
Architecture at a glance
- Transport: WebSockets via graphql-ws for subscriptions
- API: Apollo Server (v4) with an Express HTTP layer
- Pub/Sub: In-memory (graphql-subscriptions) for demo; upgradeable to Redis
- Client: React + Apollo Client (split link routes subscriptions over WS)
- UI: Recharts (or Chart.js) for live charts
Step 1: Bootstrap the GraphQL server
Create a new folder and initialize dependencies.
mkdir gql-realtime-dashboard && cd $_
npm init -y
npm i @apollo/server express cors body-parser graphql @graphql-tools/schema graphql-subscriptions ws graphql-ws
Project structure:
.
├── package.json
├── src
│   ├── index.js
│   └── schema.js
└── README.md
Step 2: Define schema and resolvers
Create src/schema.js with a simple schema for metrics and a subscription for updates.
// src/schema.js
import { makeExecutableSchema } from '@graphql-tools/schema'
import { PubSub } from 'graphql-subscriptions'

export const pubsub = new PubSub()
const TOPIC = 'METRIC_UPDATED'

export const typeDefs = `#graphql
  scalar DateTime

  type Metric {
    id: ID!
    name: String!
    value: Float!
    ts: DateTime!
  }

  type KPI {
    name: String!
    value: Float!
  }

  type Query {
    metrics: [Metric!]!
    kpis: [KPI!]!
  }

  type Subscription {
    metricUpdated: Metric!
  }
`

let latest = [
  { id: 'cpu', name: 'cpu_load', value: 0, ts: new Date().toISOString() },
  { id: 'rps', name: 'requests_per_sec', value: 0, ts: new Date().toISOString() },
  { id: 'err', name: 'error_rate', value: 0, ts: new Date().toISOString() }
]

export const resolvers = {
  Query: {
    metrics: () => latest,
    kpis: () => latest.map(m => ({ name: m.name, value: m.value }))
  },
  Subscription: {
    metricUpdated: {
      subscribe: () => pubsub.asyncIterator([TOPIC])
    }
  }
}

export const publishMetric = (metric) => {
  latest = latest.map(m => (m.id === metric.id ? metric : m))
  pubsub.publish(TOPIC, { metricUpdated: metric })
}

export const schema = makeExecutableSchema({ typeDefs, resolvers })
Step 3: Wire up WebSocket subscriptions with graphql-ws
Set up the HTTP and WS servers in src/index.js.
// src/index.js
import http from 'http'
import express from 'express'
import cors from 'cors'
import { json } from 'body-parser'
import { ApolloServer } from '@apollo/server'
import { expressMiddleware } from '@apollo/server/express4'
import { WebSocketServer } from 'ws'
import { useServer } from 'graphql-ws/lib/use/ws'
import { schema, publishMetric } from './schema.js'

const PORT = process.env.PORT || 4000

async function start() {
  const app = express()
  const httpServer = http.createServer(app)

  // WebSocket server for subscriptions
  const wsServer = new WebSocketServer({ server: httpServer, path: '/graphql' })
  const serverCleanup = useServer(
    {
      schema,
      context: async (ctx) => {
        // Example auth via connectionParams
        const token = ctx.connectionParams?.authorization || null
        return { token }
      }
    },
    wsServer
  )

  const apollo = new ApolloServer({ schema })
  await apollo.start()

  app.use(
    '/graphql',
    cors(),
    json(),
    expressMiddleware(apollo, {
      context: async ({ req }) => ({ token: req.headers.authorization || null })
    })
  )

  // Simulated data stream
  const rand = (base, jitter) => base + (Math.random() - 0.5) * jitter
  setInterval(() => {
    const ts = new Date().toISOString()
    publishMetric({ id: 'cpu', name: 'cpu_load', value: Math.max(0, Math.min(100, rand(55, 25))), ts })
    publishMetric({ id: 'rps', name: 'requests_per_sec', value: Math.max(0, rand(120, 80)), ts })
    publishMetric({ id: 'err', name: 'error_rate', value: Math.max(0, rand(1.2, 1.0)), ts })
  }, 1000)

  httpServer.listen(PORT, () => {
    // eslint-disable-next-line no-console
    console.log(`HTTP and WS server running on http://localhost:${PORT}/graphql`)
  })
}

start().catch((e) => console.error(e))
Run the server:
node src/index.js
Step 4: Test the subscription
Use a GraphQL IDE that supports graphql-ws (e.g., GraphQL Yoga app, Apollo Sandbox). Try this subscription:
subscription OnMetricUpdated {
  metricUpdated {
    id
    name
    value
    ts
  }
}
You should see a new payload every second.
Step 5: Create the React client
Bootstrap a React app with Vite and install Apollo Client, graphql, graphql-ws, and Recharts.
npm create vite@latest dashboard-client -- --template react
cd dashboard-client
npm i @apollo/client graphql graphql-ws recharts
npm run dev
Create src/apollo.js to configure HTTP and WS links with a split.
// src/apollo.js
import { ApolloClient, InMemoryCache, HttpLink, split } from '@apollo/client'
import { GraphQLWsLink } from '@apollo/client/link/subscriptions'
import { getMainDefinition } from '@apollo/client/utilities'
import { createClient } from 'graphql-ws'

const httpLink = new HttpLink({ uri: 'http://localhost:4000/graphql' })

const wsLink = new GraphQLWsLink(
  createClient({
    url: 'ws://localhost:4000/graphql',
    connectionParams: async () => ({
      // pass auth if needed
      authorization: localStorage.getItem('token') || ''
    })
  })
)

const splitLink = split(
  ({ query }) => {
    const def = getMainDefinition(query)
    return def.kind === 'OperationDefinition' && def.operation === 'subscription'
  },
  wsLink,
  httpLink
)

export const client = new ApolloClient({ link: splitLink, cache: new InMemoryCache() })
Step 6: Build the dashboard UI
Replace src/main.jsx and src/App.jsx with a live dashboard that renders a chart and KPIs from the subscription stream.
// src/main.jsx
import React from 'react'
import ReactDOM from 'react-dom/client'
import { ApolloProvider } from '@apollo/client'
import { client } from './apollo'
import App from './App'
import './index.css'

ReactDOM.createRoot(document.getElementById('root')).render(
  <React.StrictMode>
    <ApolloProvider client={client}>
      <App />
    </ApolloProvider>
  </React.StrictMode>
)
// src/App.jsx
import React from 'react'
import { gql, useQuery, useSubscription } from '@apollo/client'
import { LineChart, Line, XAxis, YAxis, Tooltip, ResponsiveContainer, Legend, CartesianGrid } from 'recharts'

const KPIS = gql`
  query KPIs {
    kpis { name value }
  }
`

const SUB = gql`
  subscription OnMetricUpdated {
    metricUpdated { id name value ts }
  }
`

const formatTs = (iso) => new Date(iso).toLocaleTimeString()

export default function App() {
  const { data: initial } = useQuery(KPIS)
  const [series, setSeries] = React.useState([])
  const [kpis, setKpis] = React.useState({})

  useSubscription(SUB, {
    onData: ({ data }) => {
      const m = data.data.metricUpdated
      setSeries((prev) => {
        const next = [...prev, { ts: m.ts, [m.id]: m.value }]
        // keep last 60 points
        return next.slice(-60)
      })
      setKpis((prev) => ({ ...prev, [m.id]: m.value }))
    }
  })

  React.useEffect(() => {
    if (initial?.kpis) {
      const start = new Date().toISOString()
      const seed = initial.kpis.reduce((acc, k) => ({ ...acc, [k.name]: k.value }), {})
      setSeries([{ ts: start, ...seed }])
      setKpis(initial.kpis.reduce((acc, k) => ({ ...acc, [k.name.includes('cpu') ? 'cpu' : k.name.includes('requests') ? 'rps' : 'err']: k.value }), {}))
    }
  }, [initial])

  // Normalize series for Recharts by merging points with same timestamp
  const merged = React.useMemo(() => {
    const byTs = new Map()
    for (const point of series) {
      const key = point.ts
      byTs.set(key, { ...(byTs.get(key) || { ts: key }), ...point })
    }
    return Array.from(byTs.values())
  }, [series])

  return (
    <div style={{ background: '#0b0f14', color: '#e6f1ff', minHeight: '100vh', padding: 24 }}>
      <h1 style={{ margin: 0, marginBottom: 16 }}>GraphQL Real-time Dashboard</h1>
      <div style={{ display: 'grid', gridTemplateColumns: 'repeat(3, 1fr)', gap: 12, marginBottom: 16 }}>
        <KPI label='CPU Load (%)' value={kpis.cpu?.toFixed?.(1) ?? '…'} />
        <KPI label='Requests/sec' value={kpis.rps?.toFixed?.(0) ?? '…'} />
        <KPI label='Error Rate (%)' value={kpis.err?.toFixed?.(2) ?? '…'} />
      </div>

      <div style={{ background: '#0f1621', border: '1px solid #1b2633', borderRadius: 8, padding: 12 }}>
        <h3 style={{ marginTop: 0 }}>Live Metrics (last 60s)</h3>
        <ResponsiveContainer width='100%' height={320}>
          <LineChart data={merged} margin={{ top: 5, right: 20, bottom: 5, left: 0 }}>
            <CartesianGrid stroke='#1b2633' />
            <XAxis dataKey='ts' tickFormatter={formatTs} stroke='#8ba3b8' />
            <YAxis stroke='#8ba3b8' />
            <Tooltip labelFormatter={(v) => formatTs(v)} />
            <Legend />
            <Line type='monotone' dataKey='cpu' name='CPU %' stroke='#00e5ff' dot={false} isAnimationActive={false} />
            <Line type='monotone' dataKey='rps' name='RPS' stroke='#7cff6b' dot={false} isAnimationActive={false} />
            <Line type='monotone' dataKey='err' name='Errors %' stroke='#ff6b6b' dot={false} isAnimationActive={false} />
          </LineChart>
        </ResponsiveContainer>
      </div>
    </div>
  )
}

function KPI({ label, value }) {
  return (
    <div style={{ background: '#0f1621', border: '1px solid #1b2633', borderRadius: 8, padding: 16 }}>
      <div style={{ fontSize: 12, color: '#8ba3b8' }}>{label}</div>
      <div style={{ fontSize: 28, fontWeight: 700 }}>{value}</div>
    </div>
  )
}
Start the client and verify the chart and KPIs update in real time as the server publishes.
Step 7: Authentication and security
For production, secure both HTTP and WS layers.
- Auth: Send a JWT via HTTP Authorization header for queries/mutations and via connectionParams for WS subscriptions. Validate in context and attach user claims.
- TLS: Use wss (WebSocket over TLS) in production. Terminate TLS at a reverse proxy (e.g., Nginx) or your cloud load balancer.
- Origin & CORS: Lock down allowed origins and headers. On Express, configure cors with a whitelist.
- Rate limits: Throttle connection attempts and message throughput to prevent abuse.
- Schema hardening: Disable introspection in prod if desired, add depth/complexity limits, and prefer allow-listing operations.
Example WS client with token refresh:
import { createClient } from 'graphql-ws'

export const ws = createClient({
  url: 'wss://api.example.com/graphql',
  connectionParams: async () => ({ authorization: await getFreshToken() })
})
Step 8: Scaling and performance
- Pub/Sub backend: Replace in-memory PubSub with Redis, NATS, or Kafka. Each subscription server instance listens to the same topic and can publish updates across replicas.
- Backpressure: If producers outpace consumers, batch updates or downsample values (e.g., publish aggregates per second).
- Fan-out: For high-volume topics, consider a gateway (Apollo Router or GraphQL mesh) and coalesce frequent updates on the edge.
- Serialization: Keep payloads slim; avoid large arrays per tick. Use numeric IDs and short field names where feasible.
- Transport alternatives: If your infra prefers HTTP, evaluate Server-Sent Events (SSE) via graphql-sse. It simplifies proxies and works well at scale, though it is one-way.
Step 9: Local testing and troubleshooting
- Connection path: Ensure the WS client uses the same path you configured (e.g., ws://localhost:4000/graphql).
- CORS vs WS: CORS affects HTTP, not WS; however, proxies may block Upgrade. Check reverse proxy config for Upgrade and Connection headers.
- Health probes: Add a simple HTTP health endpoint and a GraphQL ping query for readiness.
- Time sync: Client and server clocks should be roughly aligned to avoid confusing timestamps.
- DevTools: Apollo Client DevTools helps inspect operations and cache; use browser Network tab to observe WS frames.
Production deployment tips
- Containerize both server and client, and deploy behind a TLS-terminating proxy. Verify that your proxy forwards Upgrade requests for WebSockets.
- Autoscale based on concurrent connections and message rates, not just CPU.
- Observability: Emit metrics for subscription count, messages per second, and average payload size. Trace operations for hot spots.
- Graceful shutdown: Close WS servers with a drain period to let clients reconnect to healthy nodes.
Optional: Persisted timeseries
For historical views, persist metrics to a TSDB (TimescaleDB, InfluxDB) and expose a GraphQL query for historical ranges. Keep the subscription for the live tail. On the client, stitch results so the chart shows history plus new points in real time.
Recap and next steps
You built a full-stack GraphQL real-time dashboard with:
- A subscription-enabled schema
- A Node.js server broadcasting over WebSockets
- A React client that renders live charts
Next, consider:
- Switching to Redis Pub/Sub for horizontal scale
- Adding authentication and role-based access control
- Implementing SSE as a fallback where WS is blocked
- Persisting data for historical analysis and alerts
Real-time UX is about trust. Keep updates smooth, payloads lean, and errors visible. With subscriptions in place, your dashboards can be as fast as your data.
Related Posts
GraphQL Subscriptions: A Practical Real‑Time Data Tutorial
Build real-time apps with GraphQL Subscriptions: step-by-step server, client, auth, scaling, and testing guidance using Node, WebSockets, and graphql-ws.

Build a GraphQL API and React Client: An End‑to‑End Tutorial
Learn GraphQL with React and Apollo Client by building a full stack app with queries, mutations, caching, and pagination—step by step.

GraphQL Live Queries vs Subscriptions: How to Choose for Realtime Apps
GraphQL live queries vs subscriptions: semantics, transports, scaling, caching, and DX compared—learn when to use each and how to combine them.