API Consumer Analytics: From Raw Calls to Product Insight
A practical guide to API consumer analytics: what to track, how to instrument, and how to turn raw API calls into product and revenue insights.
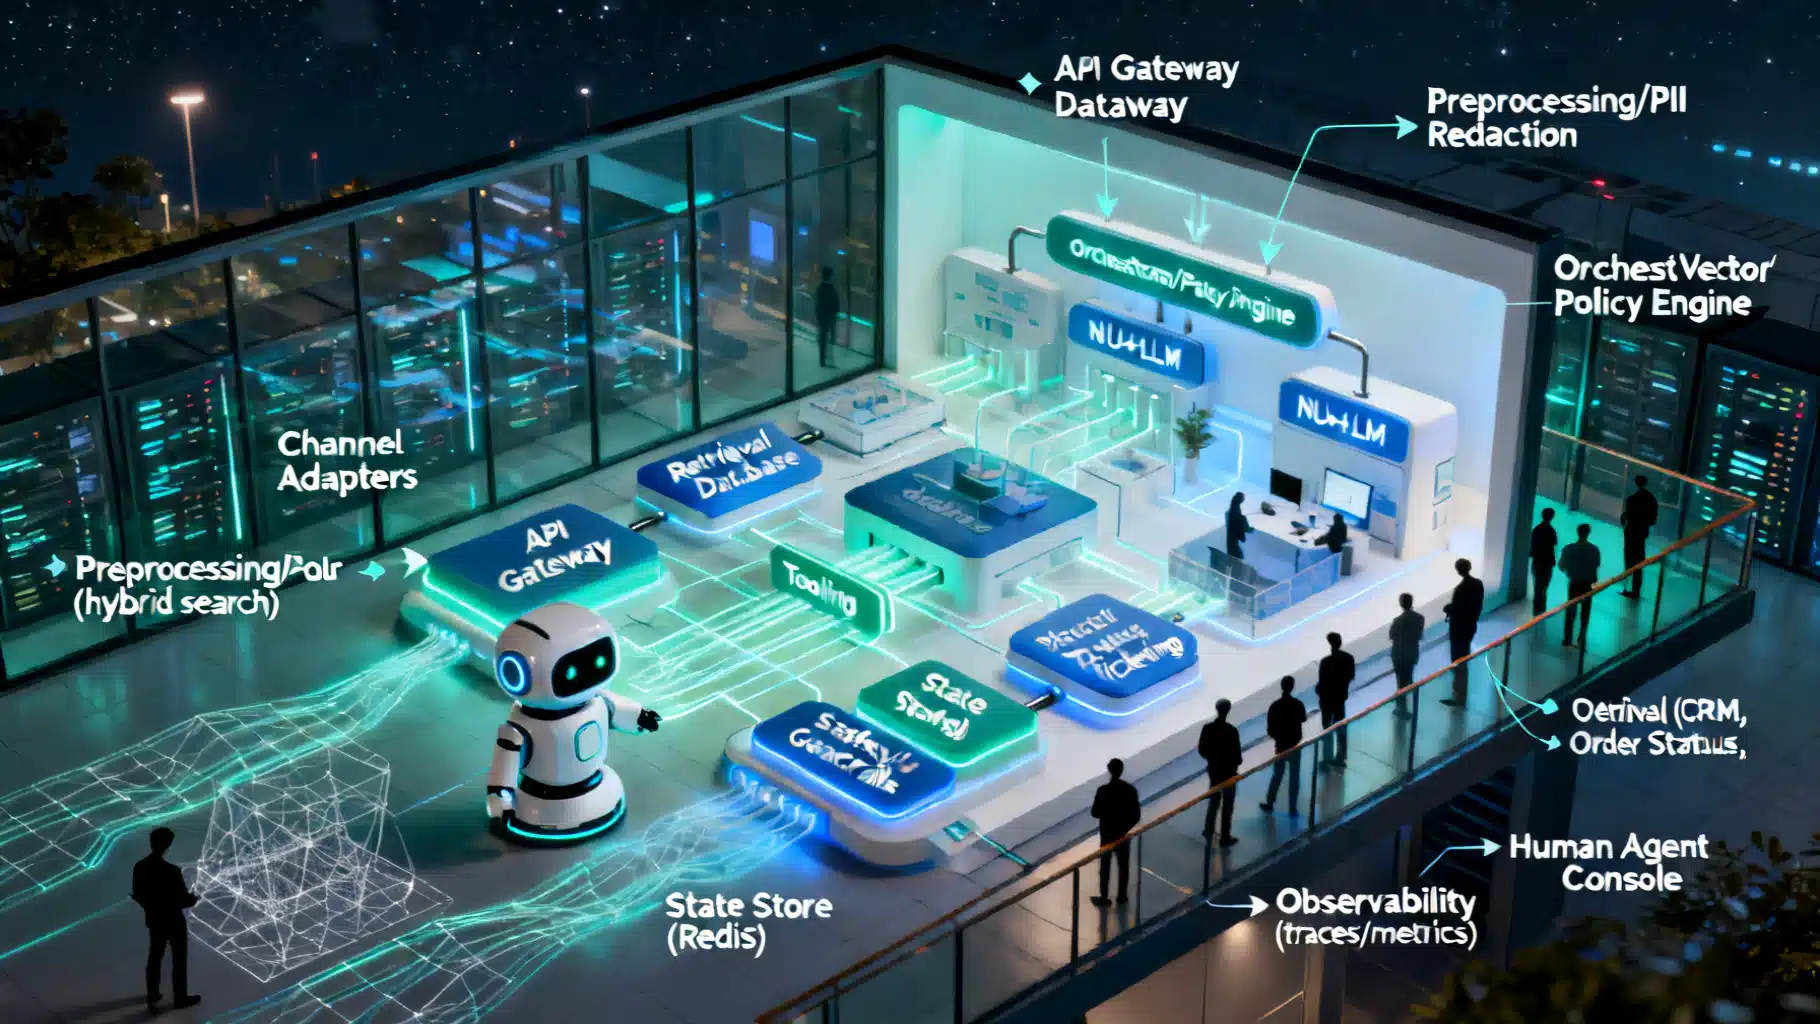
Image used for representation purposes only.
Why API consumer analytics matters
APIs are no longer just integration points—they are products. Like any product, you need to understand who is using it, how, and to what effect. API consumer analytics tracks the behavior of developers, applications, and organizations that call your APIs so you can:
- Improve reliability by finding performance bottlenecks per consumer.
- Drive adoption by identifying friction in onboarding and usage.
- Optimize revenue by aligning pricing and limits with real usage patterns.
- Reduce risk by surfacing anomalous or abusive traffic early.
Done well, analytics becomes a feedback loop between engineering, product, and go‑to‑market teams.
Defining the “consumer”
“Consumer” can mean different things depending on your model:
- Individual developer identity (e.g., user account that registered a key)
- OAuth client or service account
- Application (mobile app, backend service) sometimes mapped 1:many to keys
- Organization/tenant (company using your API)
- Plan/tier (free, pro, enterprise) that constrains limits and features
Analytics should support views at all these levels and let you pivot between them.
Core metrics to track
Track metrics that tell a coherent story from request to value:
- Traffic and adoption
- Total requests, unique consumers, active apps (DAU/WAU/MAU), new vs returning
- Endpoint coverage: % of endpoints hit per consumer
- Performance
- Latency percentiles (p50/p95/p99), tail amplification per consumer and per endpoint
- Upstream dependency latency contributions
- Reliability and quality
- Error rates by status code class (4xx vs 5xx), error taxonomy (validation, auth, rate-limit)
- Retries, timeouts, circuit-breaker opens
- Cost and monetization
- Requests and data egress per plan, unit economics (cost/request), revenue per consumer
- Overages, quota utilization, seasonal patterns
- Security and abuse signals
- Token failures, IP diversity, unusual geos, header spoofing, scraping cadence
- Product adoption
- Feature flags used, version adoption (v1 vs v2), funnel milestones (key issued → first successful call → 100th call)
Telemetry design: identifiers and schema
Good analytics starts with consistent identifiers:
- api_key_id or client_id
- application_id, developer_id, organization_id
- plan_id, region, environment (prod/stage)
- endpoint (service, path template, method), api_version, feature_flag
- request_id (end‑to‑end), trace_id/span_id (OpenTelemetry)
Best practices:
- Normalize endpoint paths to templates (/orders/{id}) to avoid high‑cardinality explosions.
- Record both raw status_code and normalized error_type.
- Capture both request_time and service_time; include queuing, network, and upstream timings when possible.
- Avoid PII in events; hash or tokenize where necessary.
Instrumentation approaches
You have several ways to capture events—mix and match:
- API gateway/native proxies (Kong, Apigee, NGINX, Envoy): low friction, consistent edge metrics.
- Service mesh (Istio/Linkerd): uniform request telemetry across services.
- Application middleware/SDKs: fine‑grained, domain events, business context.
- OpenTelemetry (OTel): standardize traces, metrics, and logs; export to multiple backends.
- Log shipping and stream capture: Fluent Bit, Vector, or gateway plugins emitting to Kafka/Kinesis/Pub/Sub.
Aim for: gateway logs for coverage, OTel traces for causality, app events for product context.
Storage and processing architecture
Telemetry is high‑volume and time‑ordered. Typical backbone:
- Ingest: HTTP/OTLP receivers → message bus (Kafka/Kinesis) for durability and backpressure.
- Processing: stream processors (Flink/Spark/Kafka Streams) for enrichment and aggregation.
- Storage:
- Time‑series DB (Prometheus/ClickHouse/Influx) for SLOs and dashboards.
- Data warehouse (Snowflake/BigQuery/Redshift) for exploration, cohorts, and billing.
- Object storage (S3/GCS) for cold retention and reprocessing.
- Serving: BI (Looker/Power BI), notebooks, Grafana, custom portals.
Partition by event_time and organization_id. Keep a small set of pre‑aggregations (hourly per consumer per endpoint) to accelerate dashboards.
Attribution and segmentation
Every chart should be sliceable by:
- Consumer identity: developer, app, org, plan
- API surface: service, endpoint, method, version
- Geography and network: region, PoP, ASN, IP family
- Client traits: SDK version, runtime, device class
- Experiment/feature flag: control vs treatment
This is what turns raw counts into insight.
Analyses that move the needle
- Onboarding funnel: key issued → first 200 OK → first 100 calls → first error-free day.
- Retention: cohort retention by signup week and plan; API‑hour stickiness.
- Feature adoption: v2 migration curve, SDK uptake.
- Revenue: ARPC (avg revenue per consumer), LTV by segment, free→paid conversion triggers.
- Efficiency: cost/request by endpoint; identify “loss‑leader” endpoints.
- Reliability: consumer‑weighted vs request‑weighted SLOs to ensure fairness.
Real-time monitoring and SLOs
Define and publish SLOs per critical endpoint (e.g., 99.9% of /payments POST under 300 ms, 28‑day window). Build:
- Error budget burn alerts (fast/slow burn)
- Anomaly detection on consumer behavior (sudden spikes, geolocation drift)
- Rate‑limit alerting before hard throttles to enable proactive outreach
Privacy, compliance, and governance
- Data minimization: store only what’s needed for stated purposes.
- Pseudonymize identifiers; keep mapping tables in a separate, access‑controlled store.
- Respect regional data residency; tag events with region and enforce routing.
- Retention policies per field class; automate deletion for right‑to‑erasure (GDPR/CCPA).
- DPA and audit trails for access to analytics datasets.
A/B testing and experiments with APIs
Experiment at the edge or in the app layer:
- Version flags: route a % of consumers to v2 of an endpoint.
- Pricing experiments: trial extended quotas to a subset of free users.
- Behavior changes: new pagination default or error payloads.
Measure impact on success rate, latency, adoption, and conversion; guardrail with SLOs.
Edge cases and data quality
- Retries and idempotency: de‑duplicate using idempotency_key + request_id.
- Caches/CDNs: count cache_hits separately; attribute to origin vs edge.
- Batch/background jobs: tag job_type to avoid inflating “active developer” counts.
- Mobile variability: include network_type to explain tail latency.
- Clock skew: prefer server receive_time; include monotonic durations.
Implementation blueprint: 30‑day MVP
Week 1
- Define event schema and ID conventions. Choose gateway log format and OTel exporter.
- Stand up ingestion (OTLP + Kafka) and create a “raw_events” topic.
Week 2
- Ship gateway access logs and app spans to Kafka. Enrich with org_id, plan_id.
- Build stream job to produce hourly aggregates per consumer×endpoint.
Week 3
- Load aggregates to warehouse daily; define core models (traffic, latency, errors, quota use).
- Create Grafana/BI dashboards and SLOs for top 5 endpoints.
Week 4
- Add onboarding funnel metrics and weekly retention cohorts.
- Wire alerts for error budget burn and abuse anomalies.
- Run first v2 adoption experiment on 5% of traffic.
Sample event schema
{
  "event_type": "api_request",
  "event_time": "2026-05-16T14:32:10.124Z",
  "request_id": "0f3c...",
  "trace_id": "a1b2...",
  "consumer": {
    "developer_id": "dev_123",
    "application_id": "app_987",
    "organization_id": "org_acme",
    "plan_id": "pro",
    "client_id": "oauth_456"
  },
  "api": {
    "service": "orders",
    "endpoint": "/orders/{id}",
    "method": "GET",
    "version": "v2"
  },
  "network": {
    "region": "us-east-1",
    "pop": "iad50",
    "asn": 15169,
    "ip_family": "ipv6"
  },
  "timings": {
    "request_duration_ms": 182,
    "upstream_ms": 120,
    "queue_ms": 8
  },
  "result": {
    "status_code": 200,
    "error_type": null,
    "cache": { "hit": false, "status": "miss" }
  },
  "quota": { "bucket": "read", "consumed": 1 },
  "flags": { "experiment": "v2_rollout", "variant": "treatment" }
}
Sample queries
Traffic and error rate by plan (daily):
SELECT
  DATE_TRUNC('day', event_time) AS day,
  plan_id,
  COUNT(*) AS requests,
  100.0 * SUM(CASE WHEN status_code >= 500 THEN 1 ELSE 0 END) / COUNT(*) AS error_rate_pct
FROM api_events
GROUP BY 1, 2
ORDER BY 1, 2;
Latency percentiles per endpoint (hourly):
SELECT
  DATE_TRUNC('hour', event_time) AS hour,
  endpoint,
  APPROX_PERCENTILE(request_duration_ms, 0.50) AS p50,
  APPROX_PERCENTILE(request_duration_ms, 0.95) AS p95,
  APPROX_PERCENTILE(request_duration_ms, 0.99) AS p99
FROM api_events
GROUP BY 1, 2
ORDER BY 1, 2;
Cohort retention from key issuance:
WITH signups AS (
  SELECT developer_id, DATE_TRUNC('week', key_issued_at) AS cohort_week
  FROM developers
),
activity AS (
  SELECT developer_id, DATE_TRUNC('week', event_time) AS active_week
  FROM api_events
  GROUP BY 1, 2
)
SELECT s.cohort_week,
       a.active_week,
       COUNT(DISTINCT a.developer_id) AS active_devs,
       COUNT(DISTINCT s.developer_id)  AS cohort_size,
       1.0 * COUNT(DISTINCT a.developer_id) / COUNT(DISTINCT s.developer_id) AS retention
FROM signups s
LEFT JOIN activity a USING (developer_id)
GROUP BY 1, 2
ORDER BY 1, 2;
Build vs. buy
- Gateway‑native analytics: quick start, limited deep analysis; great for ops dashboards.
- Observability stacks (OTel + Prometheus/Grafana/Tempo/Jaeger): powerful for reliability and traces; add warehouse for product analytics.
- Analytics SaaS (PostHog, Amplitude, Mixpanel): rich cohorts/funnels; ensure they support server‑side high‑volume data and privacy needs.
- Data lakehouse + BI: maximum flexibility and ownership; higher engineering lift.
Criteria: event throughput, cost controls, cardinality handling, retention, privacy features, SDK support, and ability to segment by consumer.
Security of the analytics pipeline
- Encrypt in transit (mTLS) and at rest (KMS‑managed keys).
- Isolate ingestion on private networks; no public endpoints for collectors.
- Fine‑grained access control with column/row‑level security (mask tokens, hash IPs).
- Provenance and immutability: append‑only logs, checksums, lineage metadata.
- Secret hygiene: never log raw credentials, tokens, or full payloads unless explicitly whitelisted.
Common pitfalls
- High cardinality explosions (raw paths, user agents). Normalize and sample.
- Counting retries as business success. Deduplicate and track retry reasons.
- Conflating 4xx and 5xx. Separate client vs server mistakes.
- Over‑aggregating too early. Keep raw events for audits and new questions.
- Ignoring multi‑tenant fairness. Track consumer‑weighted metrics, not just request‑weighted.
Success checklist
- Clear event schema with stable IDs and templates for paths.
- Ingestion with backpressure and dead‑letter handling.
- Real‑time SLOs and alerting for top endpoints.
- Warehouse models for funnels, cohorts, and revenue.
- Dashboards sliceable by consumer, endpoint, version, plan, and region.
- Documented data governance (PII policy, retention, residency).
- Regular business reviews with product, support, and sales.
Conclusion
API consumer analytics transforms guesswork into evidence. By instrumenting at the edge and in the application, modeling data for attribution, and operationalizing insights in real time, you’ll accelerate adoption, protect reliability, and align pricing and product with how developers actually use your API. Start with a crisp schema and a 30‑day MVP, then iterate—your consumers’ behavior will tell you what to build next.
Related Posts
Designing a Robust AI Customer Support Chatbot Architecture
A practical blueprint for building scalable, safe AI support chatbots—from NLU and RAG to orchestration, guardrails, and observability.
GraphQL Error Handling Best Practices: Clear, Secure, and Resilient APIs
A practical guide to GraphQL error handling: schema design, HTTP codes, partial data, masking, client patterns, observability, and examples.
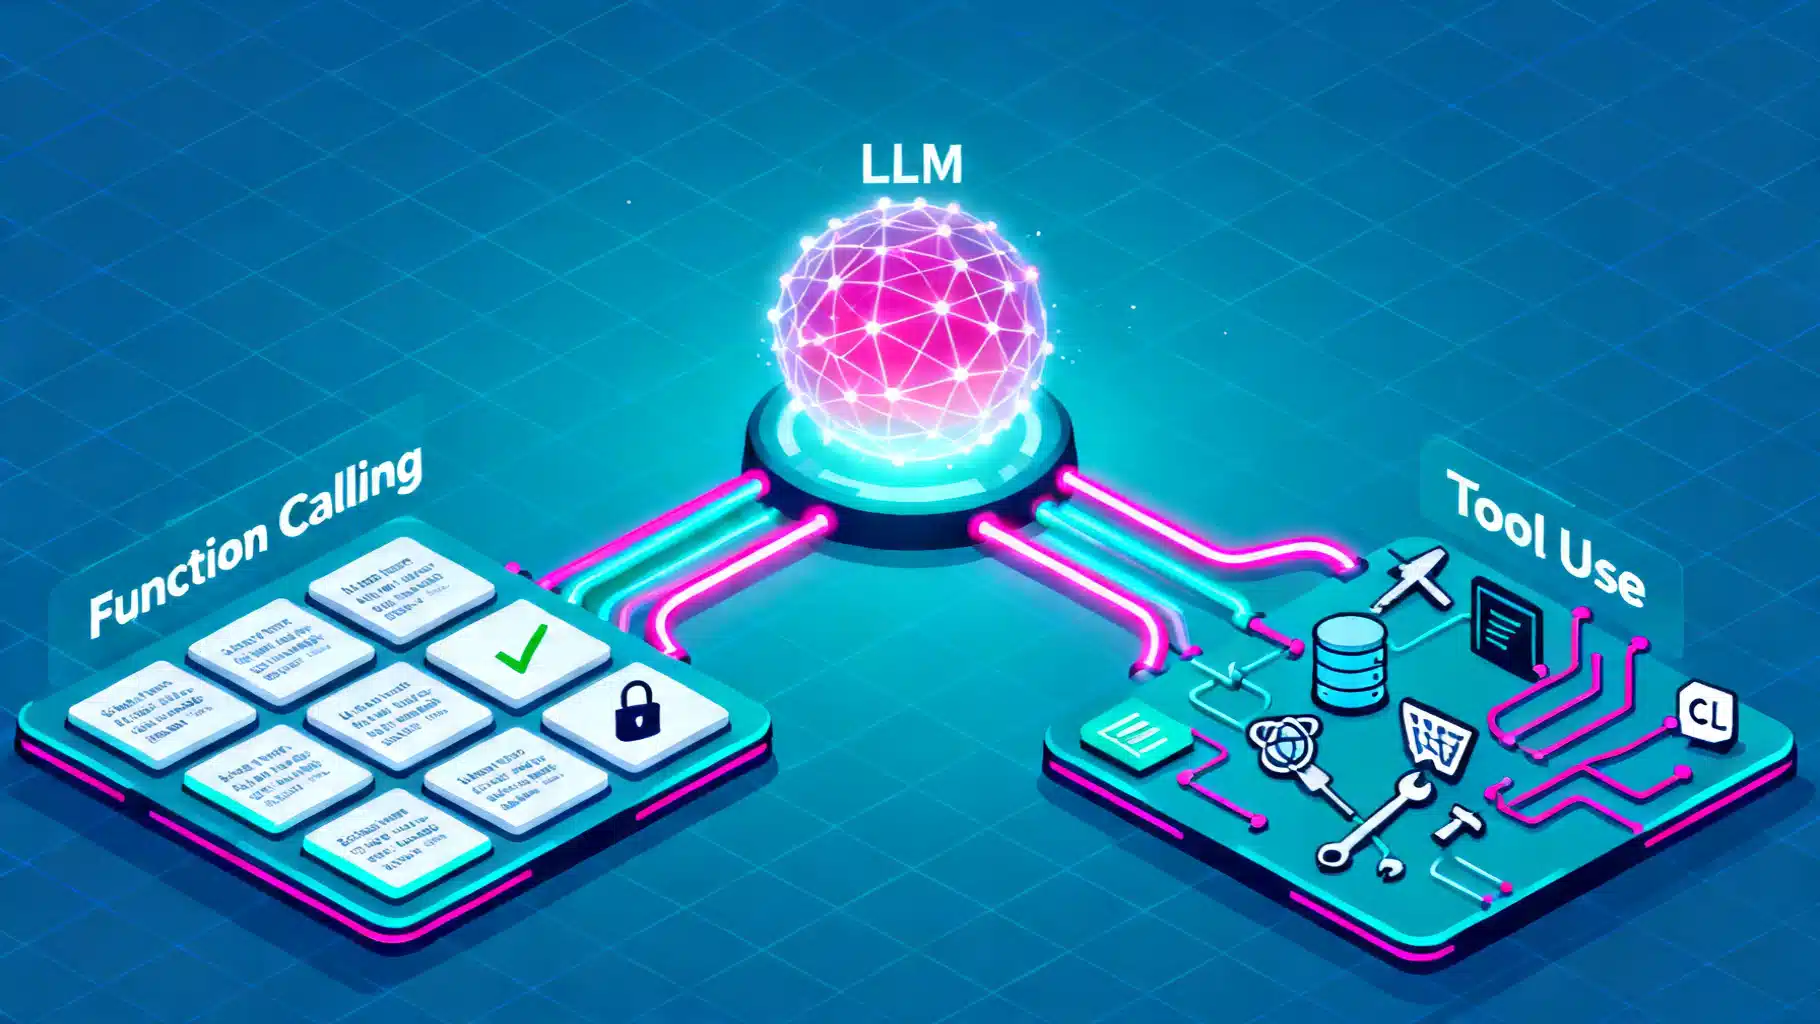
Function Calling vs. Tool Use in LLMs: Architecture, Trade-offs, and Patterns
A practical guide to function calling vs. tool use in LLMs: architectures, trade-offs, design patterns, reliability, security, and evaluation.